This article is for me like the cherry on top. I spent a lot of time checking how power history and power supply details can be used by DFIR analyst, and finally I found another source of useful information. Multiple times (during investigations that I was conducting), I encountered (either in $MFT or in $UsnJrnl) files located in SleepStudy folder. The files I am talking about, are named as follows:
- ScreenOnPowerStudyTraceSession-<date and time>.etl
- User-not-present-trace-<date and time>.etl
I did some research, but unfortunately I did not find much information about it. Nevertheless there are two really good articles (at least in my opinion) that talk about ETL files, but they do not exactly tell what can be found inside ETL files created in the SleepStudy location.
- First article – Marcos Fuentes Martínez did a VERY good job testing when SleepStudy’s files are crated and when modified. He also speaks about powercfg.exe /SleepStudy which gives a really nice output illustrating the machine’s states (on/off/hibernated etc.). But that only works on the “life” machine.
- Second article – Nicole Ibrahim described several ETL files, that may be VERY valuable during the forensic investigation. You SHOULD read it!
Nicole Ibrahim listed few ETL files which provide forensic data, but they still require further investigation. Anyway I listed them for you below:
- C:\ProgramData\Microsoft\Windows\Power Efficiency Diagnostics -> energy-ntkl.etl
- C:\ProgramData\Microsoft\Windows\Power Efficiency Diagnostics -> energy-trace.etl
- C:\Windows\System32\WDI\LogFiles -> BootCKCL.etl
- C:\Windows\System32\WDI\LogFiles -> ShutdownCKCL.etl
- C:\Windows\System32\WDI\LogFiles -> SecondaryLogonCKCL.etl
- C:\Windows\System32\LogFiles\WMI -> LwtNetLog.etl
- C:\Windows\System32\LogFiles\WMI -> Wifi.etl
- C:\Users\\AppData\Local\Microsoft\Windows\Explorer -> ExplorerStartupLog.etl
- C:\Users\\AppData\Local\Microsoft\Windows\Explorer -> ExplorerStartupLog_RunOnce.etl
- C:\Windows\System32\WDI\<GUID>\<GUID> -> snapshot.etl
- C:\Windows\Panther -> setup.etl
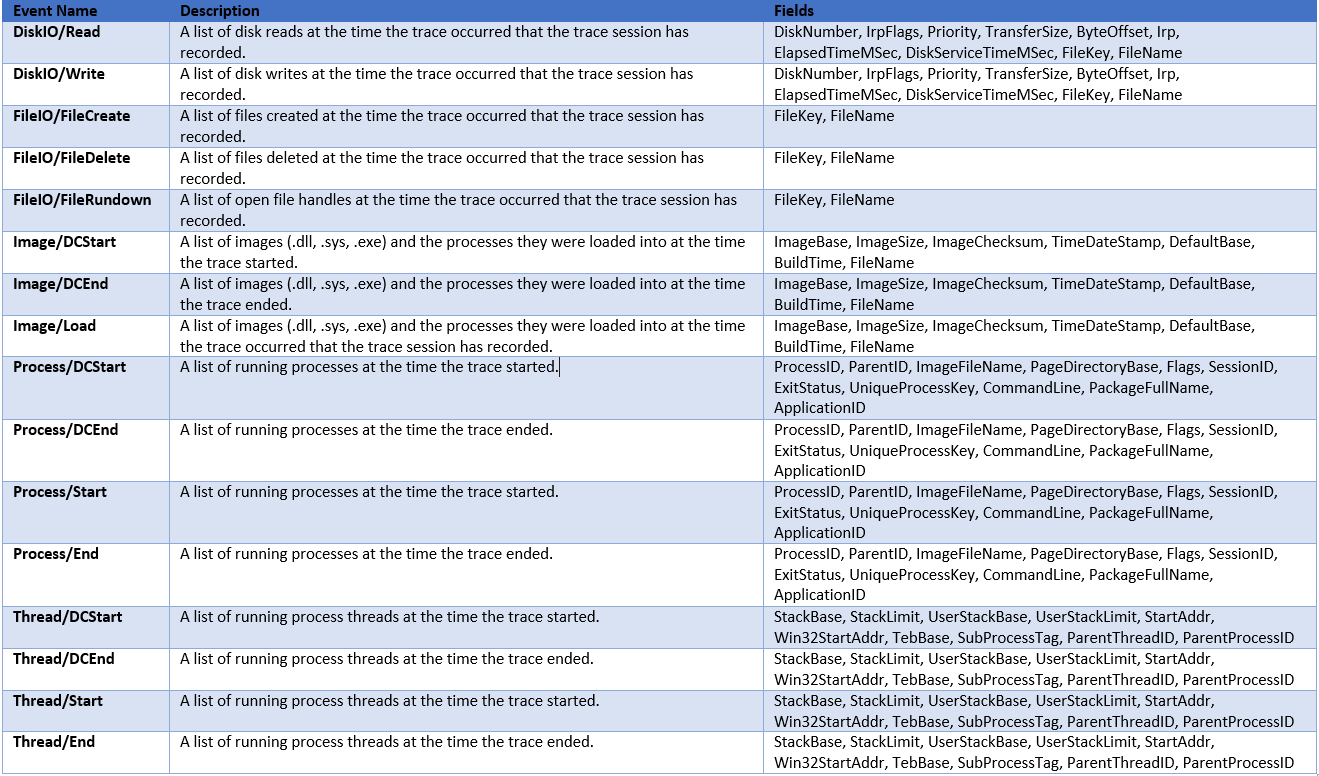
What is more, he really well documented information found in BootCKCL. These findings can be found here, but unfortunately it’s a PNG file (no way to copy text). So to give you a quick overview of the information you can find there, I will tell you that it stores information about processes that were started during the BOOT time including all loaded modules! (.dll, .sys, .exe). So, if you have a malicious software executed during the boot time (achieved by persistence), you will get the path, process name and all loaded modules.
But returning to the subject of this article, let me start from the beginning. There are two paths that keep ETL files that I am talking about:
- C:\Windows\System32\SleepStudy
- C:\Windows\System32\SleepStudy\ScreenOn
For me it was always a puzzle to understand how to open an ETL file. The Windows’s default tool, named Windows Performance Analyzer tells me less than NOTHING (an example below).

But there are other tools that you can use to open this type of files, but none of them gives the output I want to get. The best Windows’s tool in my opinion is Microsoft Message Analyzer, but there are others like Windows Event Viewer, TraceView or PerfView. There is even a Windows’s native tool named tracerpt, which allows you to convert ETL to CSV. Full command looks like that: tracerpt filename.etl -o output.csv -of CSV.
But as the ETL file was a big puzzle for me, first I had to spend some time to find out what ETL means. Based on Microsoft’s website, ETL means Event Trace Log. The full definition looks like that “an event trace log (.etl) file, also known as a trace log, stores the trace messages generated during one or more trace sessions. The system first stores the trace messages that trace providers generate in trace session buffers, and then delivers them directly to a trace consumer or writes them to a trace log.”
Simply saying, ETL (Event Trace Logs) files are created by ETW (Event Tracing for Windows) trace sessions and then are saved on the disk. It is not something new, as Event Tracing was introduced in Windows 2000.
Based on my research, the structure of that files has been never publicly released by Microsoft, but there is one guy named Geoff Chappell, who documented his findings on this website. I have to admit that I have not figured out how I can parse that files myself using .Net. (yet), but I found one ETL parser released by forensiclunch, which works pretty well. And this is the tool, that I used to create my first parser allowing me to get all useful information in TLN format.
I also found two .NET classes that can potentiality be used to read ETL files:
To get all information that I am attaching below, I had to restart, put to sleep and hibernate my machine several times. Then I took and parsed all ETL files found in these two locations: C:\Windows\System32\SleepStudy\ and C:\Windows\System32\SleepStudy\ScreenOn.
I was parsing them using ETLParser, and in results getting CSV files. The execution of ETLParser looks like that:

The tool generates a CSV file that keeps all information extracted from the ETL files, below you can find the example.

Then I studied all CSV files that I was getting, to see what logs are generated by the OS. Below you can find all important forensic logs, I was able to discover and document!
First let’s focus on the information that we can find analyzing files located in C:\Windows\System32\SleepStudy\.
All timestamps found reviewing ETL files located in C:\Windows\System32\SleepStudy\ are INACCURATE! They do not give precise time indicating when the even occurred, it seems to be related to the creation and modification time of the ETL files. In my tests timestamps were always delayed few minutes.
First I found two events (AcDcStateRundown/Info and AcDcStateChange/Info) that based on my observations track the AC status. These two logs seems to be generated on the regular basis (but later I will show you better log, indicating if the battery is in use or not).
Meaning: The battery not in use.
Probably triggers on regular basis.
Payload: ‘AcOnline: True’
Event Name: AcDcStateRundown/Info
Provider: Microsoft-Windows-Kernel-Power
Probably triggers when the charger is unplugged (not sure about it)
Payload: ‘AcOnline: True’
Event Name: AcDcStateChange/Info
Provider: Microsoft-Windows-Kernel-Power
Event named SessionDisplayOn/Info shows when the system was resumed, but it also gives some logs which does not mean much. But it is easy to distinguish them.
What is more, events named SessionUnlocked/Info show that the session was unlocked. It applies to logins that took place after HIBERNATION, SLEEP and also standard logouts.
Meaning: The system start up, and the logon to the system.
Meaning: The system start up (logs are delayed ~1 minute).
Payload:
– ‘Session: 1’, ‘Console: True’, ‘Reason: Resume from Hibernate (0x00000019)’
– ‘Session: 1’, ‘Console: True’, ‘Reason: Full Wake (0x00000009)’
Event Name: SessionDisplayOn/Info
Provider: Microsoft-Windows-Kernel-Power
The login to the system (matches SessionDisplayOn/Info, but is even more delayed)
Payload: ‘SessionId: 1’, ‘Console: True’
Event Name: SessionUnlocked/Info
Provider: Microsoft-Windows-Kernel-Power
Events named SessionDisplayOff/Info and SessionLocked/Info show that the system went into the HIBERNATE or SLEEP mode, and then the session was locked down.
Meaning: The system HIBERNATION/SLEEP, the active session was locked.
Payload: ‘Session: 1’, ‘Console: True’, ‘Reason: 20’
Event Name: SessionDisplayOff/Info
Provider: Microsoft-Windows-Kernel-Power
Payload: ‘SessionId: 1’, ‘Console: True’
Event Name: SessionLocked/Info
Provider: Microsoft-Windows-Kernel-Power
WakeDevicesPhaseStart/PhaseStart and WakeDevicesPhaseStop/PhaseStop events indicate that devices (connected to the system) were woken up. It occurs when the system comes back to the RUNNING mode.
Meaning: The system start up.
Payload: “PAYLOAD_DUMP: ” (it may be broken)
Event Name: WakeDevicesPhaseStart/PhaseStart
Provider: Microsoft-Windows-Kernel-Power
Payload: “PAYLOAD_DUMP: ” (it may be broken)
Event Name: WakeDevicesPhaseStop/PhaseStop
Provider: Microsoft-Windows-Kernel-Power
SetSystemState/Info events indicate the system came back to the RUNNING mode from SLEEP and HIBERNATION mode. It does not indicate a logon to the system after standard logouts.
Meaning: The system start up.
Payload: ‘ExecutionState: 4’
Event Name: SetSystemState/Info
Provider: Microsoft-Windows-Kernel-Power
Below you have several logs, which show that the system went into the HIBERNATE or SLEEP mode, and then all active services and processes were suspended. Very important evens, as we can get the list of processes and services that were suspended.
Meaning:
– The system was HIBERNATED or went to SLEEP mode.
– A list of processes and services that were suspended -> subsequently the evidence of the execution (if you want to suspend something, first you have to start it).
Once the machine is sent to HIBERNATION or SLEEP mode, all active processes are suspended.
Payload: ‘Pid: 14296’, ‘NameLength: 52’, ‘Name: \Device\HarddiskVolume3\Windows\System32\LogonUI.exe’
Event Name:
– SuspendAppsStop/Stop
– SuspendAppsStart/Start
Provider: Microsoft-Windows-Kernel-Power
Going further, all active services are suspended.
Payload: ‘NameLength: 17’, ‘Name: LanmanWorkstation’
Event Name:
– SuspendServicesStop/Stop
– SuspendServicesStart/Start
Provider: Microsoft-Windows-Kernel-Power
Then the machine goes into the Hibernation or Sleep mode (logs seem to be delayed sometimes even 5-7 minutes)
Payload:
– ‘TargetState: 4‘ is generated for SLEEP mode
– ‘TargetState: 5′ is generated for HIBERNATION mode
Event Name:
– PreSleepNotification_V3/Info
– PreSleepCallbacksPhaseStop/PhaseStop
– PreSleepCallbacksPhaseStart/PhaseStart
Provider: Microsoft-Windows-Kernel-Power
Logs order:
1. SuspendAppsStop/Stop and SuspendAppsStart/Start
2. SuspendServicesStop/Stop and SuspendServicesStart/Start
3. PreSleepCallbacksPhaseStart/PhaseStart
4. PreSleepCallbacksPhaseStop/PhaseStop
5. PreSleepNotification_V3/Info
Secondly let’s focus on the information that we can find analyzing files located in C:\Windows\System32\SleepStudy\ScreenOn.
Timestamps found parsing ETL files located in C:\Windows\System32\SleepStudy\ScreenOn seems to be ACCURATE. In my tests I was able to match them to the activity that happened on the system.
My favorite event named UpdateAcDcPowerSource/Info indicates when the charger was disconnected and connected back to the device.
Meaning:
– acDcPowerSource: 1 – the charger disconnected
– acDcPowerSource: 0 – the charger connected
Meaning:
– acDcPowerSource: 1 – the charger disconnected
– acDcPowerSource: 0 – the charger connected
Payload:
– ‘acDcPowerSource: 1’, ‘SensorType: ABS’, ‘PartA_PrivTags:…’
– ‘acDcPowerSource: 0’, ‘SensorType: ABS’, ‘PartA_PrivTags:…’
Event Name: UpdateAcDcPowerSource/Info
Provider: Microsoft.Windows.Sensors.SensorService
Another “very cool” event is named DisplayStateChanged/Info and indicates when the display was turned off and then turned on again. It happens when you turn off, hibernate or put to the sleep mode your system. But it also happens when you do not use the device, and the system turn off the screen to save power.
Meaning:
– displayState: 0 – laptop’s screen turned off
– displayState: 1 – laptop’s screen turned on
Meaning:
– ‘displayState: 0’ – laptop’s screen turned off
– ‘displayState: 1’ – laptop’s screen turned on
Payload:
– ‘displayState: 0’, ‘SensorType: ABS’, ‘PartA_PrivTags:…’
– ‘displayState: 1’, ‘SensorType: ABS’, ‘PartA_PrivTags:…’
Event Name: DisplayStateChanged/Info
Provider: Microsoft.Windows.Sensors.SensorService
The event named PowerSavingBrightnessChanged/Info shows the brightness level. It is generated when the system goes to the saving mode (the user does not use the device).
Meaning: The system is not in use.
Meaning:
– ‘powerSavingBrightness: 100’ – the brightness level 100%
– ‘powerSavingBrightness: 70’ – the brightness level 70%
Payload: ‘powerSavingc: 100’, ‘SensorType: ABS’, ‘PartA_PrivTags:…”
Event name: PowerSavingBrightnessChanged/Info
Provider: Microsoft.Windows.Sensors.SensorService
The event named DisplayBrightnessAndTransitionsUpdated/Info shows the brightness level, but this time it indicates the brightness level, which was configured by the user.
Meaning: The time when the user was active, and modified the screen’s brightness.
Meaning: The value named effectiveBrightnessPercentage indicates the brightness level
Payload:’
– effectiveBrightnessPercentage: 90′, ‘effectiveBrightnessMillinits: 495000’, ‘newBrightnessTransitionTime: 250’, ‘dimmingTransitionTime: 250’, ‘dimmedBrightnessPercentage: 45’, ‘dimmedBrightnessMillinits: 247500’, ‘newDimmedTransitionTime: 250’, ‘unDimmingTransitionTime: 250’, ‘SensorType: ABS’, ‘PartA_PrivTags:…’
Event name: DisplayBrightnessAndTransitionsUpdated/Info
Provider: DisplayBrightnessAndTransitionsUpdated/Info
The last event that may be worth our attention is named IlluminanceLuxHistogram/Info and PROBABLY provides the room lux count (I guess it based on the event name). Some devices can let Windows automatically adjust screen brightness based on the current lighting conditions, but I do not have any device where I could test it. But if it does provide the room lux level, then I think it is one of the “fanciest” artifacts that we are aware of.
Meaning: Maybe the light level in the room.
Payload: RoomLuxChangeCount: \x00\x00\x00\x00\x00\x00\x00\x00\x00\x00\x00\x00\x00\x00\x00\x00\x00\x00\x00\x00\x00\x00\x00\x00\x00\x00\x00\x00\x00\x00\x00\x00\x00\x00\x00\x00\x00\x00\x00\x00\x00\x00\x00\x00\x00\x00\x00\x00\x00\x00\x00\x00\x00\x00\x00\x00\x00\x00\x00\x00\x00\x00\x00\x00\x00\x00\x00\x00\x00\x00\x00\x00\x00\x00\x00\x00\x00\x00\x00\x00\x00\x00\x00\x00\x00\x00\x00\x00\x00\x00\x00\x00\x00\x00\x00\x00\x00\x00\x00\x00\x00′, ‘RoomLuxChangeDurationInMilliSeconds: ‘, ‘HasBrightnessSliderChanged: 0’, ‘BrightnessSlider: 0’, ‘SensorType: ‘, ‘SessionGuid: {0-0-0-00000000}’, ‘PartA_PrivTags: 0’
Event name: IlluminanceLuxHistogram/Info
Provider: Microsoft.Windows.Sensors.SensorService
That’s all what I have been able to discover. In addition to that I created a C# .Net software, which uses ETLParser to parse all ETL files (provided by the user) and then filters the output to get only events listed above. At the end it creates a timeline in the TLN format. The tool can be found here. I did not have a chance to review a source code for ETLParser, so I am not able to guarantee it is save. But I hope I will create a new tool soon, which will be able to parse ETL files itself and in addition to that display ETL events in more meaningful way.